
That gap, repeated across 200 covers a night and 30 spice-heavy items on a menu, is where dry spice yields stop being a kitchen detail and start being a P&L line. The numbers add up fast. We've spent years watching signature blends drift, food costs creep, and chefs get blamed for inconsistencies that started in the prep station, not on the line.
This page is for operators who want to fix that gap by putting spice measurement on the same weight-based footing as protein and produce.
TL;DR Quick Answers
Dry Spice Yields
Dry spice yields are the conversion ratios that translate a spice's weight (grams, ounces) to volume (teaspoons, tablespoons, cups). They exist because density varies enough between spices that no single conversion factor works for all of them.
The working range: Most ground spices fall between 0.35 and 0.90 teaspoons per gram depending on density.
Dense spices (cloves, nutmeg, black pepper, cumin, cinnamon, turmeric): roughly 0.35 to 0.45 tsp/g
Medium-density spices (paprika, chili powder, curry powder, coriander): roughly 0.50 to 0.55 tsp/g
Light spices (ginger, oregano, thyme, red pepper flakes): roughly 0.60 to 0.75 tsp/g
Very light dried herbs (basil, parsley, dill): roughly 0.80 to 0.90 tsp/g
Why it matters: Accurate yield data is the foundation of recipe costing, batch scaling, and menu engineering decisions. The common "half a teaspoon per gram" shortcut creates up to a 2.5x error between the densest and lightest spices, which distorts plate cost calculations and drifts signature blends over time.
Best practice: Weigh high-volume blends on a 0.1-gram precision scale and convert recipes to weight-based specs. Volume measurements vary by who's scooping. Weight doesn't.
Top Takeaways
The points to anchor the team around:
Dry spice yields vary up to 2.5x between the densest and lightest spices, which makes universal conversion shortcuts unreliable for production work.
Inaccurate spice weights distort plate cost calculations, which means the menu engineering matrix you're working from may be classifying items incorrectly.
Sourcing matters operationally, not just ethically. Single-origin and small-batch spices bring better flavor but greater yield variability than commodity blends.
Weight-based measurement beats volume-based measurement once you cross from home cooking into multi-shift, multi-station kitchens.
The category itself, broadly defined as dried aromatic plant parts used for flavoring, covers enough material diversity that no single conversion factor will serve every kitchen.
Why Dry Spice Yields Drive Menu Engineering Decisions
The Density Problem: Why One Gram Isn't One Teaspoon
A teaspoon is a fixed volume. A gram is a fixed weight. Whether they're equivalent depends entirely on what you're measuring. Ground cloves run dense at roughly 0.35 teaspoons per gram. Dried dill weed comes in light and airy at closer to 0.90. That's a 2.5x spread between the heaviest and lightest dry spices most kitchens stock. [VERIFY against your own scale-tested data before publishing internally]
The shortcut most cooks lean on, one gram equals roughly half a teaspoon, holds up well enough that nobody questions it, but a spice yield conversion chart gives the kitchen a better, more consistent way to measure. That's how steady recipe discipline starts. Over-season the cloves in a wet rub by 15 percent and the brisket tastes different on Tuesday than it did on Saturday. Under-season the ginger in a curry paste and the bowl comes back half-finished. Neither shows up on the P&L the day it happens, but both show up on the food cost line three months later.
Yield Data In Recipe Costing And Menu Engineering
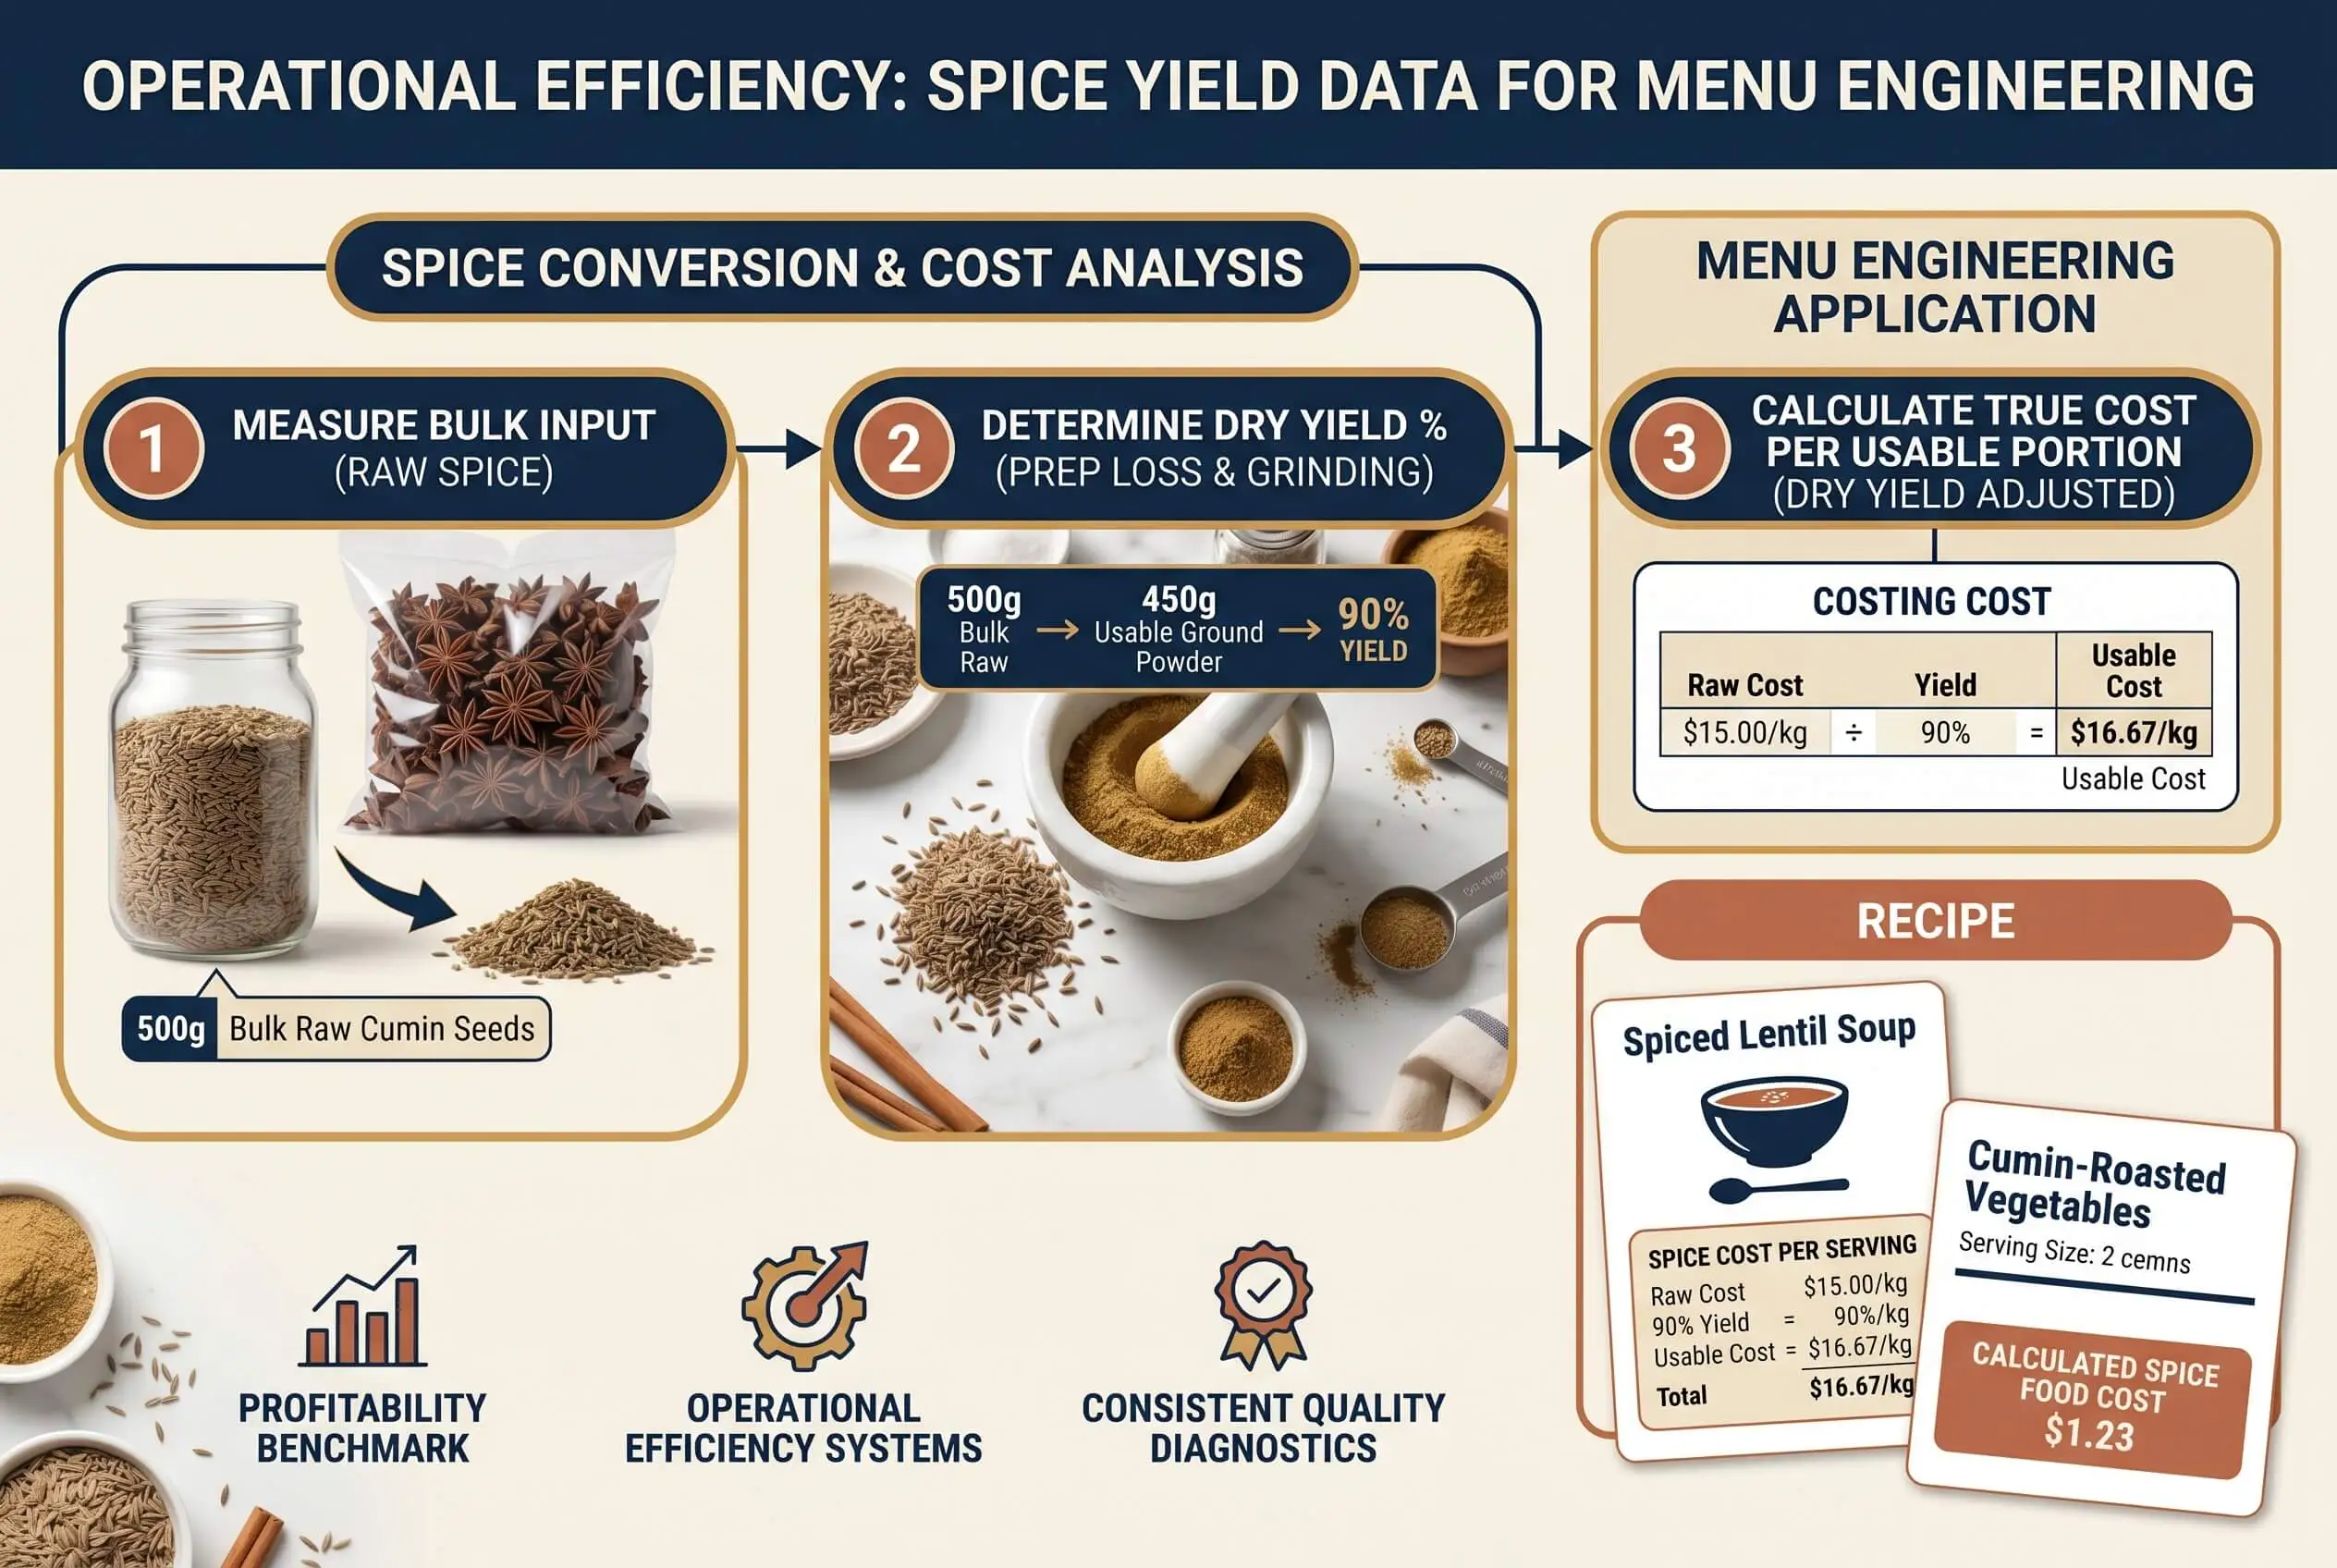
If you're costing a menu item to two-decimal precision, you can't carry a ten percent variance on its seasoning. Spice costs look small per portion. Scale them out and they aren't. A teaspoon of saffron costs real money. A pound of smoked paprika running through a high-volume blend costs more than most operators track.
The Kasavana and Smith menu engineering model classifies items as Stars, Plowhorses, Puzzles, or Dogs based on contribution margin and popularity. The framework assumes you know your true plate cost. Inaccurate spice weights distort that math from the start. A Star with an underestimated spice cost might actually be a Puzzle. A Plowhorse you've been protecting might be a Dog. Without yield data, you're engineering the wrong menu.
Sourcing Variability: How Origin And Grind Shift Yields
Spices are agricultural products. A jar of Vietnamese cinnamon and a jar of Ceylon cinnamon won't weigh the same per teaspoon. Neither will weigh the same as the bulk container of generic ground cinnamon your distributor switched you to last quarter without telling anyone. Grind size matters too. Coarse-ground black pepper is lighter per gram than fine-ground. Whole cumin seed packs differently than pre-ground.
This is where the sustainable farming angle has real operational teeth. Single-origin spices, freshly milled batches, and small-farm sourcing bring real flavor depth, but they also bring measurement variability that mass-market spice blends don't. If your supply chain prizes provenance, your yield data needs to keep pace with it.
Standardizing Yields Across Stations, Shifts, And Locations
Three cooks measuring "one teaspoon" produce three different teaspoons. Training won't fix that. The system has to change: high-volume blends and signature recipes move onto weight-based specs, and the line gets a 0.1-gram precision scale to work from.
Volume measurement is fine for home cooking and small-batch development. For production, multi-unit consistency, and accurate costing, weight is the only standard that holds up. The handful of seconds it takes to weigh a blend pays back as consistency on the plate and predictability on the food cost report.
“The protein gets weighed because the dollars are obvious. The spice gets measured because it feels small. But the dollars in a spice blend stack up across a year of service, and so do the inconsistencies. The kitchens we've seen run consistent margins year after year all share one habit: they put their spice on a scale.”
Essential Resources
The tools below cover the chain from measurement to costing to the menu framework itself. Each has earned its place in working kitchens, not just on blog roundups.
1. Precision Gram Scale Built For Small-Batch Work
A standard kitchen scale that rounds to the nearest gram loses meaningful accuracy in the 1-to-4 gram range where most spice measurements live. A 0.1-gram milligram scale closes that gap and pays for itself the first time you stop guessing on a signature blend.
Resource: American Weigh Scales GEMINI-20 Precision Milligram Scale
2. Federal Database For Spice Weights And Composition
The USDA maintains the most authoritative free database of food composition data in the United States, with weight-per-common-measure entries for hundreds of spices. Cross-check it when supplier specs feel inconsistent.
Resource: USDA FoodData Central
3. Recipe Scaling Calculator That Handles Awkward Fractions
Once spice measurements are in weight, scaling from a four-portion test to a 60-portion batch becomes math, not guesswork. This converter does the multiplication and translates results back into usable kitchen measurements.
Resource: MyKitchenCalculator Recipe Converter
4. Per-Portion Cost Calculator For Menu Pricing
Costing a menu item by weight, spices included, means you can defend the price. This calculator handles the per-serving math across every ingredient so spice cost stops being a rounding error in your plate cost.
Resource: Recipe Cost Calculator
5. Fresh-To-Dried Herb Conversion Reference
Recipes that combine fresh aromatics with dried herbs introduce a second conversion layer most kitchens get wrong. This calculator handles the substitution ratios cleanly, which matters for any recipe that flexes between seasons.
Resource: Omni Calculator Fresh-To-Dry Herb Conversion
6. Spice Blending Framework From A Culinary Institute
Building custom blends from scratch is where small measurement errors compound the fastest. This Institute of Culinary Education piece walks through professional blending logic for base notes, accents, and heat ratios, all of which assume weight-based precision as the starting point.
Resource: Institute of Culinary Education on Spice Organization
7. Menu Engineering Framework From The Original Author
Most modern restaurant analytics rest on the Kasavana and Smith menu engineering model. Michael Kasavana's own overview, published through AHLEI, walks through the Stars, Plowhorses, Puzzles, and Dogs classification and explains why contribution margin (not food cost percentage) is the right lens for menu decisions.
Resource: The Power Of Menu Engineering by Michael L. Kasavana
Supporting Statistics
Precision measurement defends margin in an industry that doesn't leave much room for error. Three numbers explain why dry spice yields belong on the priority list with labor scheduling and inventory turns.
Food Costs Average Around 32 Percent Of Restaurant Sales
The numbers: Food and beverage costs sit near a third of every dollar a restaurant takes in, while pre-tax margins typically run between two and four percent. Every basis point given back to inconsistent costing comes straight off the bottom line.
What we've observed: Operators who shift high-volume spice blends from volume to weight measurement consistently recover food cost percentage points they'd written off as unavoidable drift.
Source: National Restaurant Association, Restaurant Economic Insights
Roughly 31 Percent Of The U.S. Food Supply Goes Uneaten
The numbers: 133 billion pounds of food go uneaten at the retail and consumer levels each year, representing roughly $161 billion in lost value. [VERIFY current ERS figures before publishing] Recipe inconsistency and overproduction are meaningful contributors at the kitchen level.
What we've observed: Recipe drift forces remakes mid-service, and remakes burn through ingredients twice. Accurate yield data takes one variable out of that chain.
Source: USDA Economic Research Service, Food Loss
70 Percent Of Restaurant Food Waste Is Plate Waste
The numbers: Of all the food restaurants waste, roughly seven out of every ten pounds came out of the kitchen and went onto a guest's plate untouched or half-eaten. Inconsistent seasoning is a contributor most operators underestimate.
What we've observed: Standardized recipes built on accurate weight conversions hit flavor targets more often. Consistent flavor means cleaner plates and less waste in the dish pit.
Source: ReFED, Restaurants And Foodservice
Final Thoughts And Our Take
Spice yield data lives in the unglamorous foundation layer of restaurant operations, somewhere near calibrated thermometers and sharp knives. Nobody writes a Yelp review about your spice measurement protocol. But the chefs we've seen run consistent kitchens year after year all share a quiet habit. They treat seasoning the way they treat protein: with weights, specs, and a scale that can split a gram.
Our Take
The universal "half a teaspoon per gram" shortcut got most of us through cooking school. It won't get a multi-unit operator through a margin review. Weight-based spec sheets, density-aware yield references, and a precision scale at the prep station do more for menu engineering than any pricing software, because they fix the input data the software depends on.
The Bottom Line
Three changes pay for themselves inside a quarter:
Put a 0.1-gram precision scale at every prep station.
Convert your highest-volume spice blends to weight-based specs.
Document your ratios so a new cook on Tuesday produces the same plate as the chef who built the recipe.
None of it requires software, consultants, or a new POS. It requires a scale, a reference chart, and the discipline to use both.
Frequently Asked Questions
How do dry spice yields affect menu engineering decisions?
They decide whether your plate cost is accurate. Menu engineering classifies items by contribution margin and popularity, and contribution margin depends on knowing the true cost of the dish. If you're measuring spices by volume in the recipe but pricing the menu based on assumed gram weights, your cost data is off by anywhere from 5 to 25 percent depending on the spice. That gap shifts items between Star, Plowhorse, Puzzle, and Dog categories and changes which dishes you should be promoting, repricing, or removing.
Why don't universal teaspoons-per-gram conversions work for all spices?
Spice density varies too much. Ground cloves pack densely at around 0.35 teaspoons per gram. Dried dill weed measures closer to 0.90 teaspoons per gram. That's a 2.5x spread between the heaviest and lightest. Using a single conversion factor across that range guarantees you're over-seasoning some dishes and under-seasoning others. Density-aware conversion charts grouped by spice category solve the problem.
Should I cost recipes by spice weight or volume?
Weight. Every time, once you're past home-kitchen scale. Volume measurements vary based on who's scooping, how they level, and whether they pack or fluff. Three cooks measuring "one teaspoon" of paprika produce three different amounts. A 0.1-gram scale removes those variables. For costing, scaling, and multi-location consistency, weight is the only defensible standard.
How often should I re-verify spice yield data when changing suppliers?
Every time a supplier changes, every time a grind specification changes, and at least once a year for stable suppliers. Spice density shifts with origin, harvest year, processing method, and shelf age. A new vendor's smoked paprika won't necessarily weigh what your old vendor's smoked paprika weighed. Build a habit of weighing a one-tablespoon sample of every new spice delivery against your reference chart, and update your specs when the variance crosses 5 percent.
Start Costing Recipes With Real Yield Data
Pick one high-volume blend on your menu this week. Weigh every spice in it and compare those weights to what your recipe template says. That simple template gives the kitchen a cleaner way to see the menu you're truly running, not just the one written on the original card. That's where dry spice yields turn into real money. Bookmark this page, grab a precision scale, and rebuild your highest-volume recipes around weight specs inside a reliable recipe template. The food cost line on next month's P&L will tell you whether it worked.


