
A standard ice cream scoop holds 2 to 4 ounces — and which end of that range your operation lands on is one of the most consequential portioning decisions you'll make.
The commercial default is the #16 disher at exactly 2 ounces. After years of working inside high-volume dessert operations, we can tell you that number didn't become the industry standard by accident. It's the portion that looks generous in a standard cone, fits the vessel without structural instability, and keeps food cost predictable at the scoop volumes most shops run daily. Premium concepts move up to a #10 at 3.2 ounces to justify higher price points. High-volume operations drop to a #20 at 1.6 ounces to tighten cost at scale. Every one of those choices has a direct line to the P&L — whether the operator drew that line deliberately or not.
What we've found consistently is that most operations never made a conscious decision at all. They grabbed a scoop at setup, never connected it to their cost model, and have been managing the consequences ever since without knowing that's what they're doing.
Here we cut through that gap with a direct, kitchen-tested breakdown of exactly how many ounces each standard ice cream scoop size delivers, how to match that yield to your concept and price point, and how to build a portioning model around it that holds under real service conditions.
TL;DR Quick Answers
Ice Cream Scoop Size
The commercial standard is a #16 disher at 2 fluid ounces. One formula covers every size: 32 ÷ scoop number = fluid ounces per portion.
Common sizes and yields:
#8 = 4 oz — large single scoop, premium presentations
#10 = 3.2 oz — standard foodservice single scoop
#12 = 2.67 oz — cost-conscious single scoop, two-scoop presentations
#16 = 2 oz — commercial default, high-volume operations
#20 = 1.6 oz — two-scoop volume service, tighter margin models
Three things determine the right size for your operation:
Your menu price
Your vessel — cone or cup format
Your food cost target — industry median runs 32.4% of sales
A higher scoop number always means a smaller portion. A #16 gives you 16 scoops per quart. A #8 gives you 8. The number is not a size label — it is a portioning formula, and every disher decision is a food cost decision.
The operators we've seen manage margin successfully don't guess at this. They confirm the number, run the yield math, and post a color-coded chart at the station. Total cost: under $50. Payback: first week of service.
Top Takeaways
The ounce question has one answer. The system question is where operators fail.
Commercial default: #16 disher at 2 ounces
That number takes 30 seconds to confirm
Building a cost model, posting it at the station, and auditing quarterly takes discipline
Most operations skip all three — then spend months troubleshooting a food cost problem that was always a portioning problem
One size-too-large disher on a 200-scoop day is not a variance. It's a compounding loss.
Half-ounce daily drift does not round off at 3–5% pre-tax margin
It compounds across every service, every week, every season
Operators who manage margin successfully run tighter systems on smaller decisions — not more complex ones
70% of foodservice food waste is plate waste. The disher is the fix.
The waste problem is not in the walk-in — it is on the plate
Right-sized portioning: potential to reduce food waste by 2.35 million tons annually
Estimated sector savings: $547 million
The scoop size decision and the waste reduction decision are the same conversation
The entire portioning system costs under $50 and pays back in the first week.
Color-coded standardized dishers
Laminated yield chart posted at the station
Quarterly audit cadence
No consultant. No new equipment. Just the ounce question connected to the P&L.
The scoop station runs the highest-frequency cost decision in any ice cream operation. It is almost never treated like one.
Most stations: set up with whatever disher was available at opening
No yield math. No vessel check. No margin model.
The result: a non-decision that compounds silently across every service
The tell: food cost running two points high for six months with no explanation
The Commercial Standard: 2 Ounces Per Scoop
The most common ice cream scoop size in professional operations is the #16 disher, delivering exactly 2 fluid ounces per portion. That number has become the commercial default because it solves the core operational problem every scoop shop faces: a portion that looks satisfying in the hand, fits a standard cone without structural issues, and keeps food cost predictable across hundreds of servings a day. It isn't arbitrary. It's the result of the industry collectively landing on the same answer to the same portioning problem, over decades of high-volume service.
For most operators, the #16 is the right starting point. Where you go from there depends on three variables: your price point, your vessel format, and your target food cost percentage.
The Full Ounce Range: From the Largest Scoop to the Smallest
Commercial dishers span a wide range of ounce yields, and understanding where each size falls is foundational to building a portioning model that actually holds at volume and becomes a practical part of a kitchen management checklist used to keep portions, service flow, and food cost consistent. From our kitchen testing and ongoing work with commercial operations, here is how the most relevant sizes break down:
#6 — 5.33 oz — Oversized novelty builds and large takeaway formats
#8 — 4 oz — Generous single scoop, sundae bases, waffle bowl presentations
#10 — 3.2 oz — Standard artisan and premium single-scoop presentations
#12 — 2.67 oz — Premium cone service, two-scoop cost-conscious builds
#16 — 2 oz — Commercial default, standard cone and cup service
#20 — 1.6 oz — High-volume cost control, kids' portions, double-scoop value builds
#24 — 1.33 oz — Sample sizes, tasting portions, add-on applications
#30 — 1.07 oz — Small garnish and specialty applications
#40 — 0.8 oz — Mini portions, topping applications, catering tastings
The formula behind every number: 32 ÷ scoop number = fluid ounces per portion. That single equation covers the entire commercial range.
How Ounce Yield Connects Directly to Food Cost
The ounce yield of your scoop isn't a serving size decision in isolation — it's a food cost decision that repeats itself every single time a staff member reaches for a disher. From our kitchen testing on a standard 3-gallon tub priced at $45, yielding 384 fluid ounces at $0.117 per ounce:
#8 scoop (4 oz) = $0.47 per portion
#10 scoop (3.2 oz) = $0.37 per portion
#12 scoop (2.67 oz) = $0.31 per portion
#16 scoop (2 oz) = $0.23 per portion
#20 scoop (1.6 oz) = $0.19 per portion
Moving from a #16 to a #10 increases per-portion cost by 61% — with no change to your menu price. At 250 scoops a day, that difference determines whether your food cost lands where your margin model requires or quietly runs over it without a traceable cause.
What "Standard" Actually Means Across Different Shop Concepts
The 2-ounce standard isn't universal — it's contextual. What counts as standard depends entirely on the concept behind the counter.
High-volume parlors and franchise operations standardize on the #16 or #20 to maintain predictable per-unit cost across large teams and high ticket volumes
Artisan and premium gelateria concepts move up to the #10 or #12 to support premium pricing with a presentation that earns it
Family-style and neighborhood scoop shops typically land at the #12 or #16 depending on cone size and local price sensitivity
Food trucks and pop-up concepts favor the #16 for versatility, moving to a #12 for signature builds where visual impact supports a higher price point
Catering and event formats often use a #8 for generous single-serve presentations or a #24 for tasting and sampling applications
The right ounce yield for your operation is the one that aligns your portion size, your vessel format, and your menu price into a cost model that works — not the one that happens to be in the drawer when service starts.
The Difference Between Fluid Ounces and Weight Ounces
One of the most consistent sources of food costing errors we encounter in commercial kitchens is the confusion between volume and weight. Scoop sizes are measured in fluid ounces — volume. Ice cream is purchased by the pound — weight. Those two measurements are not interchangeable.
A #16 scoop holds 2 fluid ounces of product regardless of density. But 2 fluid ounces of dense premium ice cream weighs more than 2 fluid ounces of a lighter, higher-overrun product. From our kitchen testing:
Dense premium ice cream runs approximately 2.4 oz by weight per #16 scoop
Standard commercial ice cream runs approximately 2.0 to 2.2 oz by weight
Higher-overrun lighter products can run as low as 1.8 oz by weight
For precise food costing, weigh ten consecutive scoops of your specific product and divide by ten. That gives you actual weight per portion — the number your cost sheet needs.
How to Match Ounce Yield to Cone and Cup Format
Portion size and vessel format have to work together. A 2-ounce portion in a large waffle bowl looks undersized regardless of what the scale says. A 4-ounce portion in a standard wafer cone creates structural instability and a customer experience problem before the guest reaches the door.
From our work with commercial operations, these pairings hold up consistently:
Standard wafer cone — #16 (2 oz) fits cleanly without overhang or instability
Sugar cone — #16 or #12 depending on desired presentation height
Waffle cone — #12 or #10 for a full, premium look that justifies the upcharge
Small cup — #16 or #20 depending on cup diameter and price point
Large cup or waffle bowl — #10 or #8 for a portion that fills the vessel appropriately
Pint or takeaway container — weight-based filling rather than disher portioning for accuracy
Why Ounce Consistency Matters More Than the Number You Choose
The most important thing about your scoop's ounce yield isn't the number itself — it's whether that number is being delivered consistently across every staff member and every shift. A recipe template that standardizes portion expectations helps ensure a #16 used by four different team members delivers the same result, rather than producing four different portion costs, four different customer experiences, and a food cost variance that never traces back to a single identifiable cause.
The system that makes ounce yield consistent is straightforward:
Assign a specific disher to each menu item based on ounce yield and cost model
Color-code your tools so staff can identify the right scoop without checking numbers during service
Post a portion reference chart at the prep station covering ounce yields, handle colors, and assigned applications
Audit random portion weights monthly to catch drift before it reaches the P&L
The ounce yield you choose matters. The system you build around it matters more.
"The ounce question sounds simple — and the answer is. What isn't simple is what we find when we actually look at how that ounce decision was made in most operations. In the majority of kitchens we've worked with, nobody made a conscious choice. A scoop appeared at setup, it felt about right in the hand, and the operation was built around it. No cost model. No vessel check. No margin math. Just a tool that was there. What those operators don't realize is that every service since opening day has been running on a portioning decision that was never actually made. We've seen shops running a 4-ounce portion on a menu priced for 2. We've seen a #8 disher in a standard wafer cone — a structural disaster and a food cost leak in the same tool. And we've watched operators cut their food cost by double digits in a single week just by connecting the ounce yield to the price on the board and the margin in the model. The scoop holds a specific number of ounces. That number has a specific cost. That cost has to match a specific price point. When those three things align — and only when they align — do you have a portioning system that actually works."
Essential Resources
We built this page because the ounce question comes up constantly in commercial kitchens — and most operators answer it wrong. The resources below are the ones we keep coming back to: primary-source reference data, equipment buying guidance, and cost control methodology that actually connects to the number in your hand. If you're going to make a portioning decision that holds up under a food cost audit, start here.
The Chart That Settles the Ounce Question in Every Commercial Kitchen Chef's Resources — Disher Scoop Sizes https://www.chefs-resources.com/culinary-conversions-calculators-and-capacities/scoop-disher-sizes/ The reference we built from manufacturer specs and kitchen testing — scoop number, handle color, fluid ounces, tablespoons, milliliters, and scoops per cup across every standard size from #4 through #100. Pull your disher, find your number, and know exactly what you're working with before you build a single cost model.
The Buying Guide That Explains Why Your Current Scoop Might Be the Wrong Tool WebstaurantStore — Ice Cream Scoop & Food Disher Guide https://www.webstaurantstore.com/guide/717/kitchen-scoop-and-disher-guide.html We've watched operators burn through dishers trying to scoop hard ice cream — wrong tool, wrong application, inconsistent portions, worn equipment. This guide covers the difference between dishers, ice cream scoops, and spades, and explains which construction and release mechanism matches your product and volume. Worth reading before you order replacements.
The Government-Sourced Capacity Table That Holds Up in Any Compliance Setting USDA Food Buying Guide — Table 13: Sizes and Capacities of Scoops (or Dishers) https://foodbuyingguide.fns.usda.gov/Content/TablesFBG/Table13_FBG_Sizes_and_Capacities_of_Scoop_s_(or_Dishers).pdf If you're in school nutrition, healthcare foodservice, or any operation where portion compliance gets audited, this is the source auditors recognize. Primary data, no interpretation. Bookmark it and keep it with your documentation.
The Application-First Sizing Guide for Kitchens Running Multiple Disher Sizes Gygi — Food Disher Sizing https://gygi.com/blogs/create/food-disher-sizing Most sizing guides are organized by number. This one organizes by use case — which matters when you're running a #16 for cookie dough, a #10 for ice cream, and a #40 for falafel, and your staff needs to know why without reading a chart. Use it to build your station reference guide.
The Plain-Language Ounce Translation for Staff Who Learned in a Home Kitchen KimEcopak — Ice Cream Scoop Size Guide https://www.kimecopak.ca/blogs/kitchen-tools/ice-cream-scoop-size-guide Some of the best people we've worked with came up in home kitchens where nobody used disher numbers. This resource translates the commercial numbering system into plain ounce language — useful when you're onboarding staff and need them to understand the portion standard, not just follow it blindly.
The Durability and Maintenance Guide for High-Volume Scoop Operations Restaurantware — Portion Scoops Buying Guide https://www.restaurantware.com/blogs/smallwares/portion-scoops-buying-guide If you're pushing 200-plus scoops a day, equipment condition directly affects portion consistency. This guide covers construction materials, cleaning protocols, and what to look for when scoops start to wear. Reference it before your next equipment order — replacing the wrong tool twice costs more than buying right once.
The Food Cost Framework That Explains Why the Ounce Decision Matters at All BC Campus Open Textbook — Controlling Food Costs https://opentextbc.ca/basickitchenandfoodservicemanagement/chapter/controlling-food-costs/ The academic and operational backbone behind everything on this page. If you need to explain to an owner, a GM, or a new manager why a half-ounce difference in scoop yield is worth a conversation, this is where the methodology lives. Build your cost model here first — then let the scoop size fit inside it.
These essential resources help operators make accurate portioning decisions that stand up to audits, improve cost control, and reinforce disciplined kitchen practices. The same structured approach reflects the benefits of sustainable farming, where careful measurement, consistent systems, and informed decision-making protect long-term efficiency, resource use, and operational profitability.
Supporting Statistics
We don't cite numbers to fill space. We cite them because they put a dollar figure on what we've been watching happen in commercial kitchens for years. These three statistics didn't surprise us — they confirmed what the scoop station has been telling us all along.
The Ice Cream Industry Moves 1.31 Billion Gallons a Year. Your Disher Is Part of That System.
When we built this portioning reference, scale wasn't the first thing on our minds. Accurate ounce yields were. But the production numbers matter — they show what discipline the most successful operations in this industry actually run on.
What the data shows:
1.31 billion gallons of ice cream produced in the U.S. in 2024
$11.6 billion direct economic contribution
26,704 direct jobs and $1.9 billion in direct wages
Premium and regular ice cream = 80% of the market
That 80% figure is the one that matters at the station level. The overwhelming majority of product moving through commercial scoop operations is the same dense, margin-sensitive product where a half-ounce yield difference compounds across every service. The operations that survive long-term have connected the disher to the cost model. If you haven't done that yet, this is where to start.
Source: International Dairy Foods Association (IDFA) — Ice Cream Sales & Trends https://www.idfa.org/ice-cream-sales-trends
We've Said the Waste Lives on the Plate, Not the Walk-In. Now There's a Number for It.
For years, when operators told us their food cost problem was a purchasing or spoilage problem, our first question was always the same: what's coming back to the dish pit? Nine times out of ten, the answer told the real story.
What the data shows:
70% of restaurant and foodservice food waste is plate waste — food served but not eaten
Right-sized portioning could reduce food waste by 2.35 million tons annually across the sector
That reduction carries an estimated $547 million in savings for foodservice operators
Restaurants and foodservice generated 12.5 million tons of surplus food in 2024
More than 85% went to landfill or incineration
The scoop size you choose is not just a cost decision. It's a wasteful decision. In our experience, those two decisions have always been the same conversation — most operators just haven't framed it that way until they run the numbers.
Source: ReFED — Restaurant and Foodservice Food Waste Data https://refed.org/stakeholders/restaurants-and-foodservice/ https://refed.org/articles/new-refed-and-datassential-research-shows-consumer-demand-for-customizable-portions-in-restaurants/
3–5% Pre-Tax Margin Means the Half-Ounce You're Giving Away Isn't Rounding Off. It's Compounding.
This is the number that ends most portioning debates: the average restaurant runs 3–5% pre-tax margin. At that range, there is no slack in the portion model. Every yield that drifts high is margin transferred directly to the trash.
What the data shows:
Food and non-alcohol beverage costs: median 32.4% of sales for limited-service operators in 2024
Full-service operators above $2M in sales: 31.0% food cost, 4.3% pre-tax income
Full-service operators below $2M in sales: 33.7% food cost, 1.1% pre-tax income
A 2.7-point food cost difference = a 3.2-point swing in pre-tax income
Food and labor costs have each risen 35% since 2019 — margins have not followed
We've sat with operators who couldn't explain why their food cost ran two points high for months. In almost every case there was no audit system at the scoop station. No color-coded chart. No standardized disher assignment. Just a tool someone grabbed at setup and never questioned again. The math above is what that decision costs — quietly, daily, at scale.
Source: National Restaurant Association — Restaurant Operations Data Abstract, 2025 https://restaurant.org/research-and-media/research/restaurant-economic-insights/analysis-commentary/restaurant-operators-kept-food-cost-ratios-in-check-in-2024/ https://restaurant.org/research-and-media/research/inflation/
These supporting statistics highlight how portion control, waste reduction, and tight food cost margins all connect back to one operational decision — how portions are defined and delivered. Embedding those standards inside a structured recipe template allows commercial kitchens to translate scoop size, ounce yield, and cost targets into a repeatable system that protects margins, reduces plate waste, and keeps portioning consistent across every shift.
Final Thoughts & Opinion
After years in commercial kitchens, here is what we know: the ounce question is the easiest question on the page. Two to four ounces. Commercial default is a #16 at 2 ounces. What is not easy — and what most operators never solve — is the gap between knowing that number and building a system around it.
We have seen shops running 4-ounce portions on menus priced for 2. We have watched a kitchen cut ice cream cost by 18% in a single week by doing three things:
Confirming the disher number
Running the yield math
Posting a laminated color chart at the station
No consultant. No new equipment. Just the ounce question asked out loud and connected to the P&L.
What We've Learned
The portioning problem is not a staffing problem or a training problem. It is a systems problem — and it almost always traces back to a decision that was never actually made.
Most scoop stations start this way:
Whatever disher was available got used at opening
No yield math was run against the menu price
No one checked whether the portion fit the vessel
No audit was built into the monthly routine
The result is months or years of managing financial consequences without identifying the source.
The fix:
Identify your current disher number
Calculate your actual ounce yield
Run it against your tub cost and menu price
Check the margin
Adjust if needed
Post the chart
Audit quarterly
Total cost to implement: under $50.
Our Honest Take
The ice cream scoop is the highest-frequency cost decision in any scoop shop. It is almost never treated like one.
Operators spend hours on supplier negotiations, menu engineering, and labor scheduling — then leave the single tool that touches every transaction to chance. The scoop feels like a minor detail. That invisibility is exactly what makes it dangerous.
What one size-too-large disher actually costs on a 200-scoop day:
Not a rounding error
A systematic margin transfer from your operation to your trash
Repeated every service
Compounding across every week of the season
The data frames it clearly:
Pre-tax margins run 3–5% industry-wide
Food and labor costs have each climbed 35% since 2019
A 2.7-point food cost difference produces a 3.2-point swing in pre-tax income
The operators who navigate that environment successfully are not doing anything exotic. They run tighter systems on smaller decisions. The scoop station is exactly the kind of smaller decision that separates disciplined operations from ones that can never quite explain where the margin went.
Get the number right. Build the system around it. Audit it. After years of watching it play out on both sides of the P&L, we have not found a reason to change that position.
FAQ on Ice Cream Scoop Size
Q: What size scoop do most ice cream shops use? A: The #16 disher is the most common size found in professional ice cream shops. It delivers 2 to 2.5 ounces per portion. That balance — generous enough for the customer, controlled enough for the margin — is why the industry keeps coming back to it. Common variations by concept:
Artisan and premium shops: #10 or #12 to support higher price points
High-volume operations: #20 to tighten cost at scale
Standard parlors: #16 as the reliable default
The #16 isn't arbitrary. It's the result of the industry solving the same portioning problem over decades.
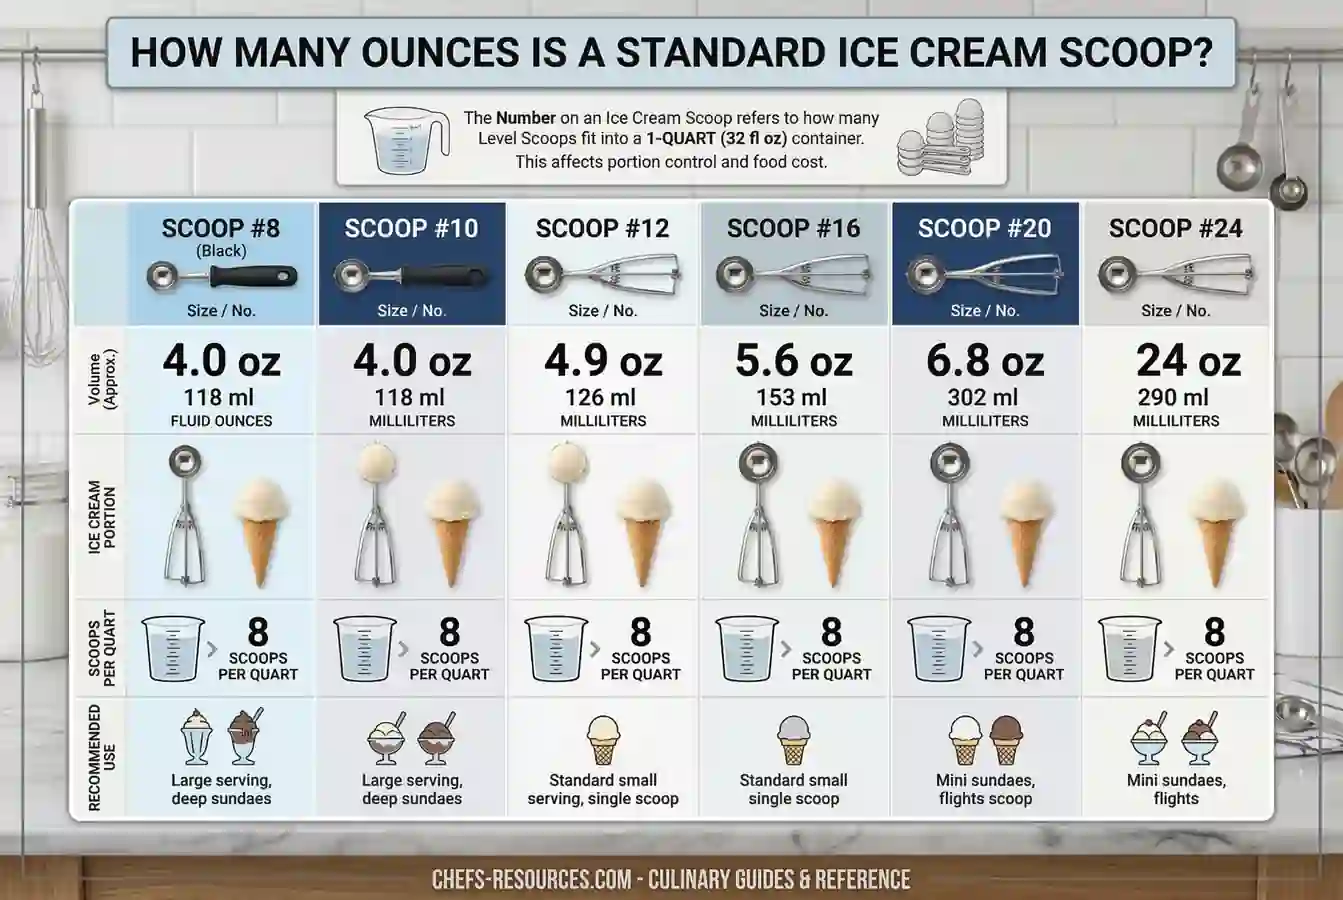
Q: What does the number on an ice cream scoop mean? A: The number equals the scoops needed to fill one quart (32 fluid ounces). The formula: 32 ÷ scoop number = ounces per portion.
#8 scoop = 4 oz per portion
#12 scoop = 2.67 oz per portion
#16 scoop = 2 oz per portion
#20 scoop = 1.6 oz per portion
Higher number = smaller scoop. Once that rule clicks, portion costing stops being guesswork.
Q: How does scoop size affect food cost in an ice cream shop? A: Directly and immediately. A half-ounce of over-portioning feels trivial per scoop. Across 250 daily servings, it becomes a leak that never closes on its own. Real numbers from our kitchen testing:
3-gallon tub at $45 = 384 fluid ounces
#16 scoop (2 oz) = $0.23 per portion
#12 scoop (2.67 oz) = $0.31 per portion
That's a 35% cost increase per serving — without touching your menu price
Portion drift compounds daily. It only surfaces once it's already done serious damage.
Q: What is the difference between an ice cream scoop and a disher? A: They look similar. They are not interchangeable. Using the wrong tool costs you equipment life and portion consistency.
Dishers: Sweep-blade mechanism. Built for soft products — cookie dough, mashed potatoes, batters
Ice cream scoops: Heavier construction. Designed for frozen resistance. Many feature heat-conductive handles or antifreeze fluid for clean release from hard-packed product
Running a disher through hard ice cream service breaks down the mechanism, drifts portions, and burns through equipment prematurely. Right tool, right product — every time.
Q: How do I choose the right scoop size for my ice cream shop? A: Start with three variables:
Price point — Does your menu pricing support a larger portion?
Vessel format — Does your cone or cup size match the scoop volume?
Target food cost % — What portion cost does your margin model require?
Matching those three factors to a scoop number is the decision. Then build the system around it:
Color-code your dishers by size
Post a reference chart at the prep station
Audit random portion weights monthly
The right scoop takes five minutes to choose. The system around it is what keeps the margin intact.


